
Figure 5.
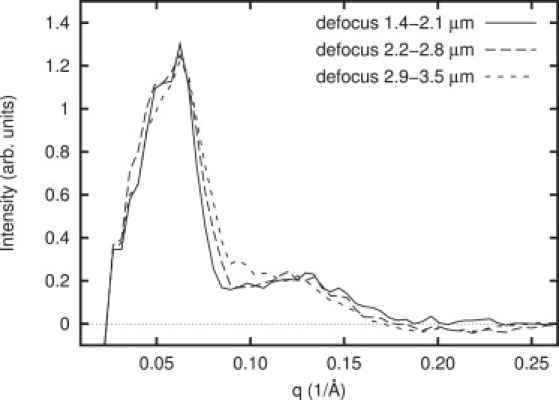
Background-subtracted power spectra of strongly perturbed vesicles grouped by defocus (ΔZ1 1.4–2.1 μm; ΔZ2 2.2–2.8 μm; and ΔZ3 2.9–3.5 μm). Despite the large difference in defocus, no significant peak position shifts occur, implying that our data is not sensitive to the defocus parameter in CTF.