
Figure 6.
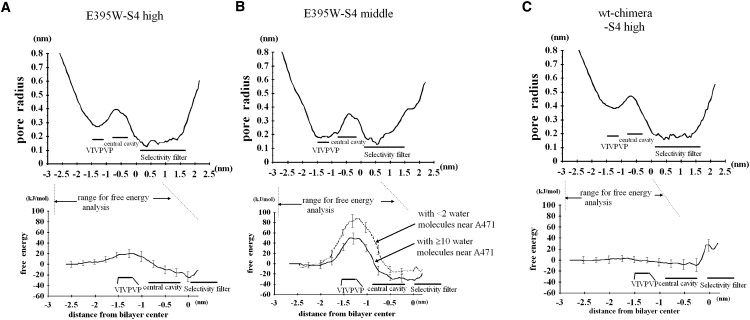
Free-energy profile for representative structures obtained from our simulations. Pore radius profile (top) and the corresponding free energy (bottom) are shown. (A) E395W-Eo-S4high. (B) E395W-Eo-S4middle. (C) wt-chimera-Eo-S4high. (A) The average and SD from three sets of the umbrella sampling procedure are shown. (B) Six trials were carried out and divided into two groups depending on the degree of the hydration (i.e., the number of the water molecules that remained at the height of A471 or L472) as described in the text. For all cases, the free energy at the position in the bulk water (0.8 nm below the Cα of V478) was set to zero.