
Figure 2.
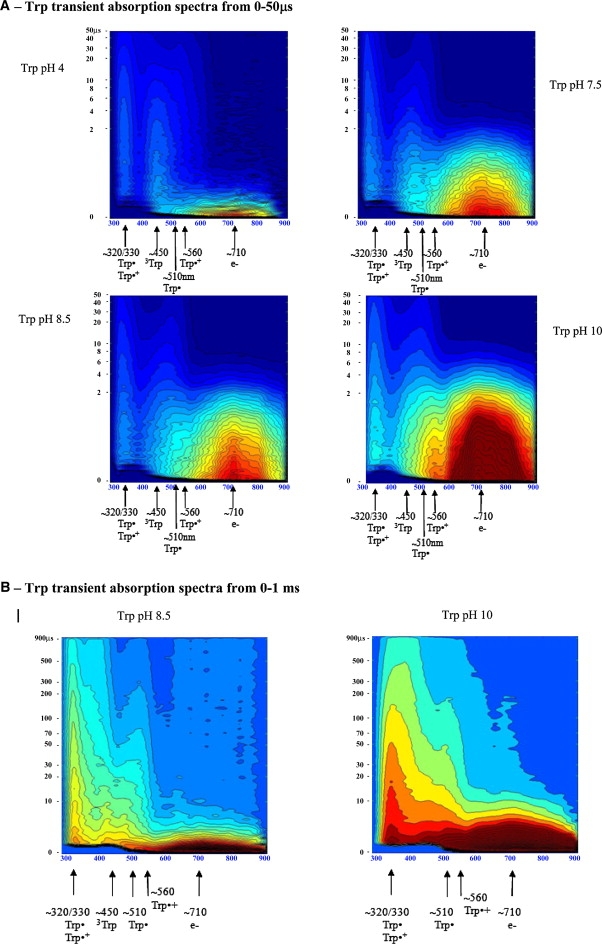
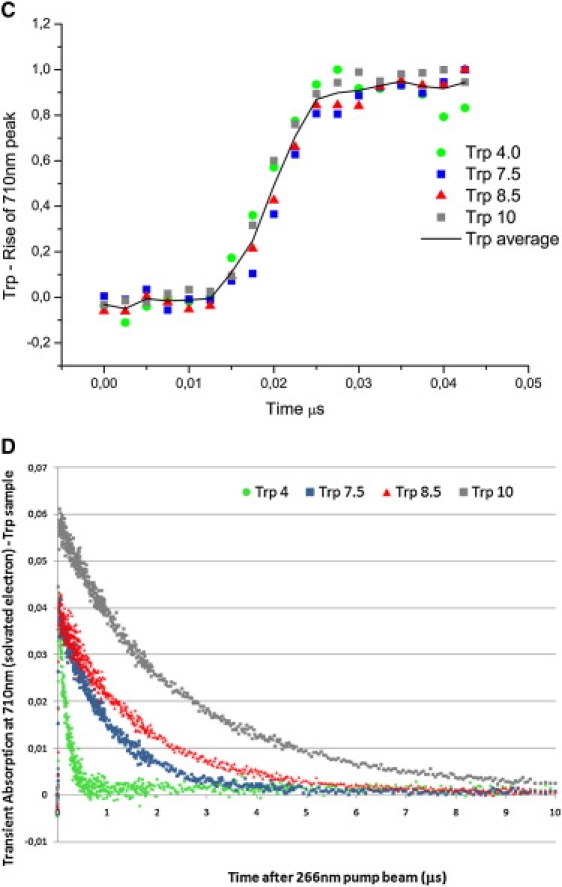
Trp transient absorption data: A shows transient absorption spectra collected at probe times from 0 to 50μs (short timescale); B shows the transient absorption spectra collected at probe times from 0 to 1ms (long timescale). Intensity of each spectrum at a particular probe time is color coded. Red codes for the highest intensity and dark blue for the lowest intensity. Putative transient absorption species assigned to each peak are listed. C displays kinetics of formation of the solvated electron within 45 ns after excitation. D displays decay kinetics of the solvated electron within 10 μs after excitation.