
Figure 4.
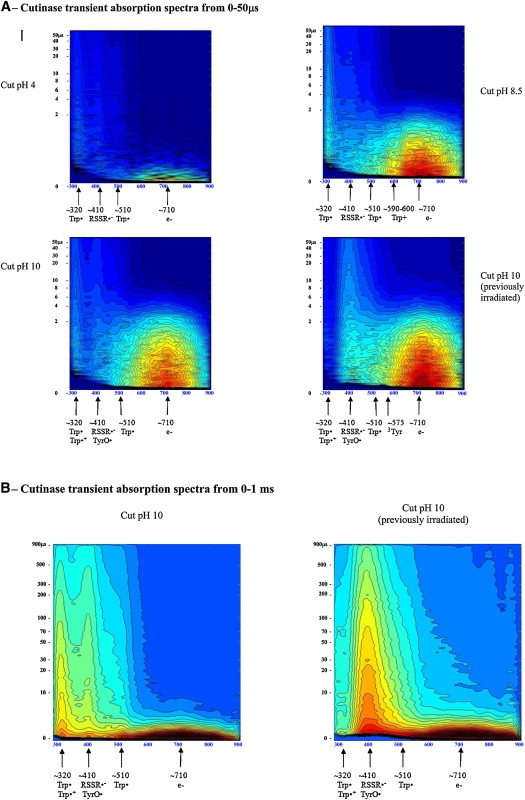
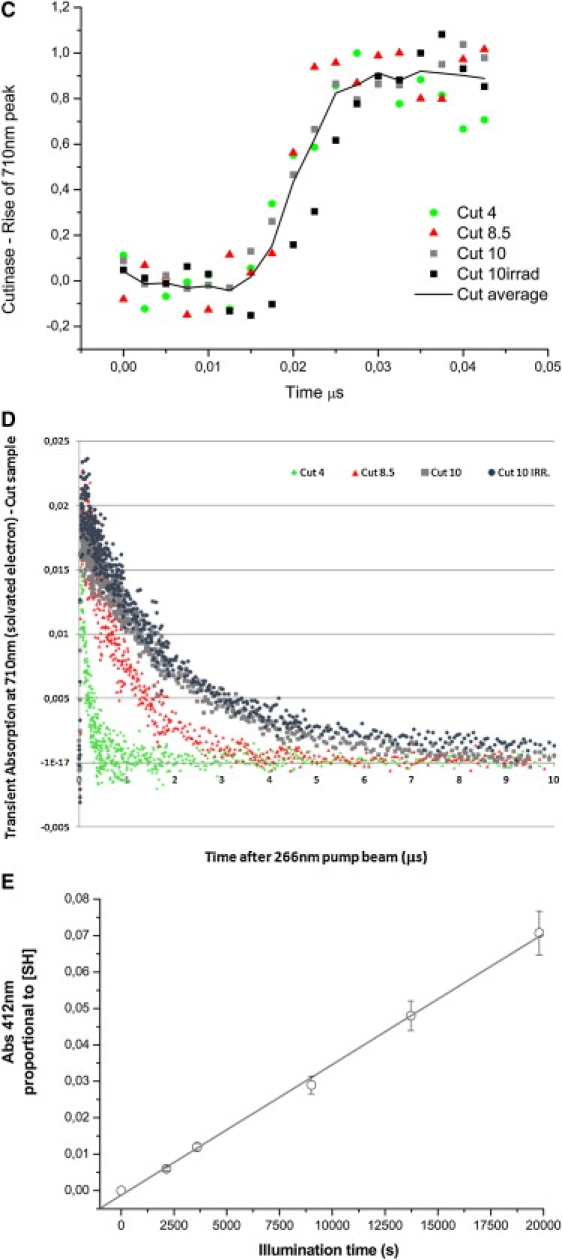
Cutinase transient absorption data: A shows transient absorption spectra collected at probe times from 0 to 50 μs; B displays transient absorption spectra collected at probe times from 0 to 1 ms. Red codes for the highest intensity and dark blue for the lowest intensity. Putative transient absorption species assigned to each peak are listed. C displays the kinetics of formation of the solvated electron within 45 ns after excitation. D shows the decay kinetics of the solvated electron within 10 μs after excitation. (E) Correlation between UV excitation (296 nm) time of cutinase solution and concentration of free thiol groups, detected with the Ellman assay (20). Free thiol concentration, proportional to Abs412nm, is the same as RSSR·− concentration.