
Figure 5.
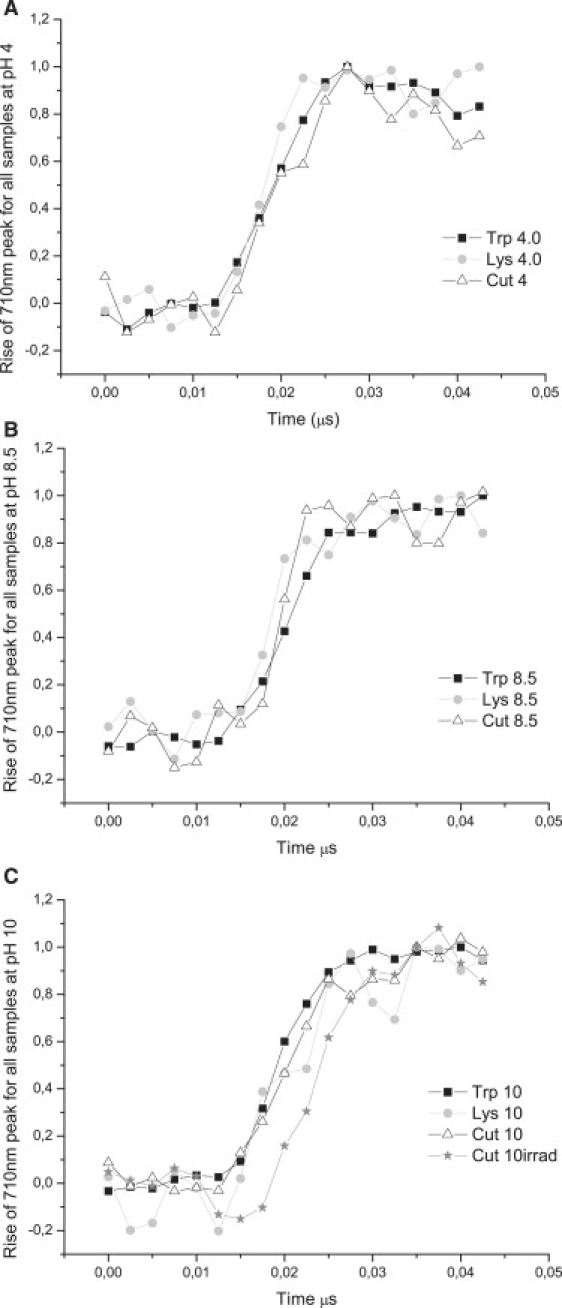
Normalized transient absorption data at 710 nm for 0–50 ns probe times displaying the kinetics of formation of the solvated electron for each sample at each pH value.
Official websites use .gov
A
.gov website belongs to an official
government organization in the United States.
Secure .gov websites use HTTPS
A lock (
) or https:// means you've safely
connected to the .gov website. Share sensitive
information only on official, secure websites.
Normalized transient absorption data at 710 nm for 0–50 ns probe times displaying the kinetics of formation of the solvated electron for each sample at each pH value.