
Figure 2.
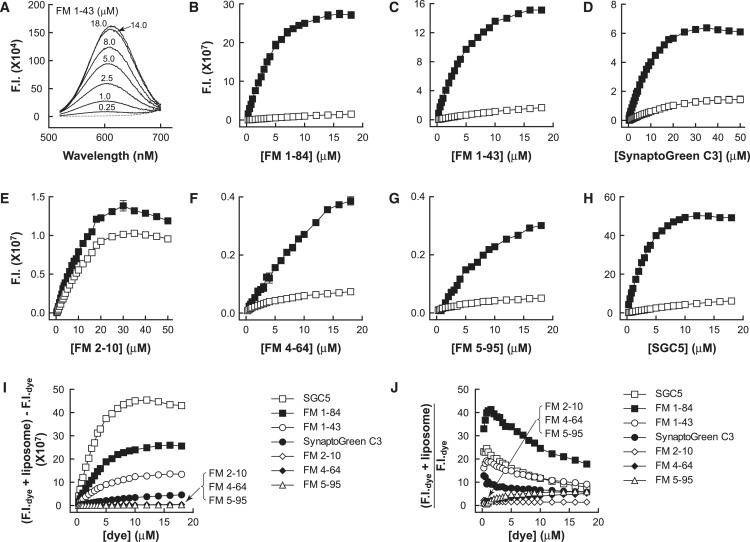
Fluorescence intensities of dye-membrane complexes as a function of increasing dye concentration. (A) Titration of liposomes (2.2 nM liposomes composed of 30% PE/70% PC) against [FM1-43]. The dashed line represents the signal obtained from liposomes only, and the solid lines are liposomes plus the indicated [FM1-43]. (B–H) Fluorescence intensities determined by integration of emission spectra of dye/liposome complexes (500–700 nm for FM1-84, FM1-43, SynaptoGreen C3, and FM2-10; 550–750 nm for FM4-64 and FM5-95; and 500–650 nm for SGC5) are indicated by solid squares. Fluorescence intensities of samples that contained dyes but lacked liposomes are indicated by open squares. (I) Dye/liposome fluorescence intensities were corrected by subtracting the free dye signals; these data are plotted versus [dye]. (J) Ratio of fluorescence intensities of dyes with and without liposomes. Error bars are the mean ± SE from three separate experiments.