
Figure 3.
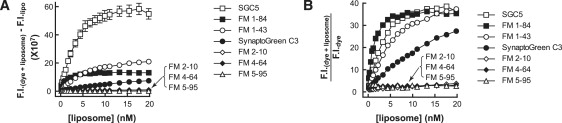
Fluorescence intensity of dye-membrane complexes as a function of liposome concentration. (A) Increase in the fluorescence intensity of a fixed concentration of each dye as a function of increasing [liposome] (30% PE/70% PC); data were corrected by subtracting signals obtained from liposome-alone samples. EC50 values, which approximate the affinities of the dyes for membranes, were determined for the three brightest dyes (SGC5, FM1-84, and FM1-43: EC50 = 4.0, 1.3, and 4.2 nM, respectively). These values are in reasonable agreement with the dissociation constants determined from the kinetic experiments described in Fig. 5 and Table 1. (B) Ratio of fluorescence intensities of all the dyes tested; SGC5, FM1-84, and FM1-43 yielded the highest signal/noise ratios. Error bars are mean ± SE from three independent experiments.