
Figure 2.
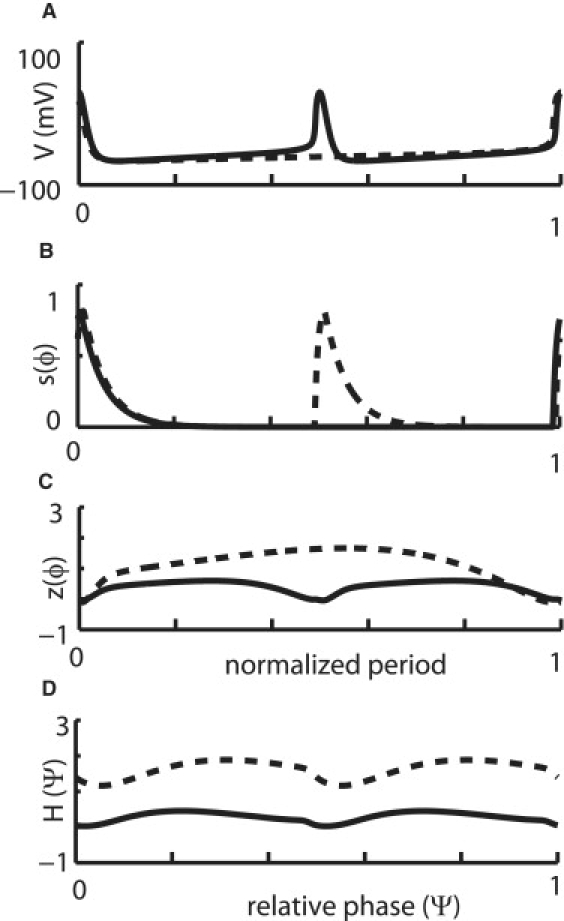
Illustration of averaged weak coupling. Iapp,F = 1.842 μA/cm2 for the fast (F) neuron (solid line) and Iapp,S = 0.77 μA/cm2 for the slow (S) neuron (dashed line). These parameter values are for two oscillators where neuron S has a free running period which is double the period of neuron F. (A) The free-running membrane potential waveforms for the fast (solid line) neuron and the slow (dashed line) neuron. This potential was used in two ways: first to obtain the postsynaptic voltage V(ϕj) to calculate the postsynaptic current i(ϕi, ϕj) = gsyns(ϕi) {V(ϕj) − Esyn} and second to calculate the presynaptic voltage V(ϕi) to drive the presynaptic activation s(ϕi). (B) The presynaptic activation calculated as described in A. Notice that the solid black trace in A drives the dotted trace in B and vice versa. (C) The adjoint (iPRC) is computed for each neuron. (D) The coupling functions computed using the averaging method for weakly coupled oscillators for each neuron are shown here. This is the only step in which the value of gsyn is taken into account. The perturbations in the synaptic current are convolved with the iPRC over the network period to calculate these functions. They were numerically calculated using XPPAUT.