
Figure 3.
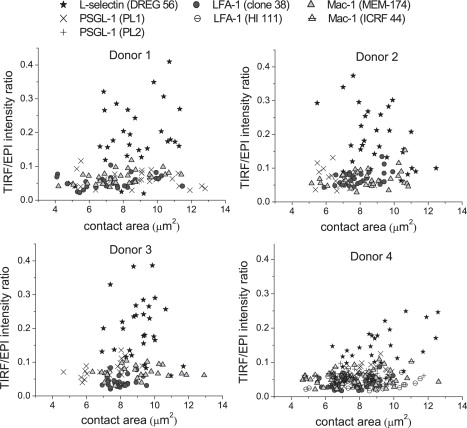
TIRF/EPI intensity ratio as a function of the cell-glass contact area extracted from the fluorescence images of L-selectin, PSGL-1, LFA-1, and Mac-1, when neutrophils were resting on glass. Each panel displays all the data collected for one donor: four proteins, 7–9 cells per antibody, and at least three points per cell. Antibodies DREG-56, PL1, clone 38, and MEM-174 were used against L-selectin, PSGL-1, LFA-1, and Mac-1, respectively. For donor 4 only, antibodies PL2, HI 111, and ICRF 44 were also used against PSGL-1, LFA-1, and Mac-1, respectively.