
Figure 5.
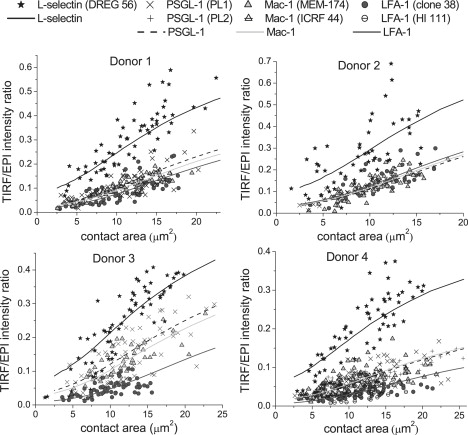
TIRF/EPI intensity ratio as a function of the cell-glass contact area for L-selectin, PSGL-1, LFA-1, and Mac-1, when neutrophils were pressed on glass. Each panel displays all the data collected for one donor: four proteins, 7–9 cells per antibody, and 4–9 points per cell. Antibodies DREG-56, PL1, clone 38, and MEM-174 were used against L-selectin, PSGL-1, LFA-1, and Mac-1, respectively. For donor 4 only, second antibodies, namely PL2, HI 111, and ICRF 44 were also used against PSGL-1, LFA-1, and Mac-1, respectively. Curves correspond to model predictions corresponding to the different molecules as indicated in the legend and for the parameters shown in Table 1.