
Figure 3.
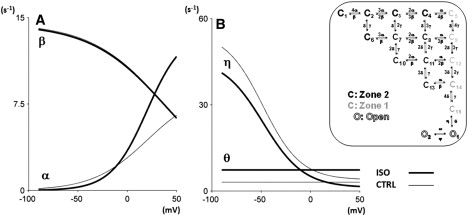
Changes in the voltage dependence of model transition rates (see schematic on the right) required to model ISO effects. (A) Zone 2 forward (α) and backward (β) transition rates. (B) Opening (θ) and closing (η) transition rates. Thin lines for control conditions; thick lines for ISO. Transitions rates unaffected by ISO not shown for simplicity.