
Figure 4.
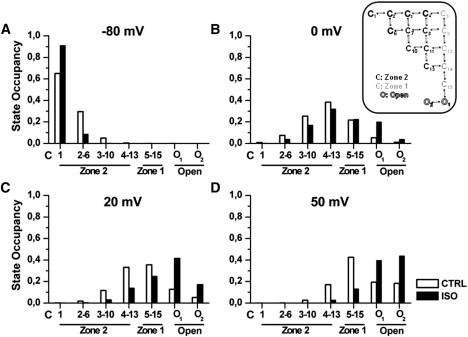
Steady-state distribution of model states occupancy at selected potentials. (A) −80 mV = diastolic. (B) 0 mV. (C) +20 mV ≅ 50% activation. (D) +50 mV ≅ 95% activation in control (open bars) and in ISO (solid bars). States (see schematic on the right) are represented on the abscissa from those farther (Zone 2) to those closer (Zone 1) to channel opening (open). State occupancy is defined as (n of channels in a state)/(total n of channels).