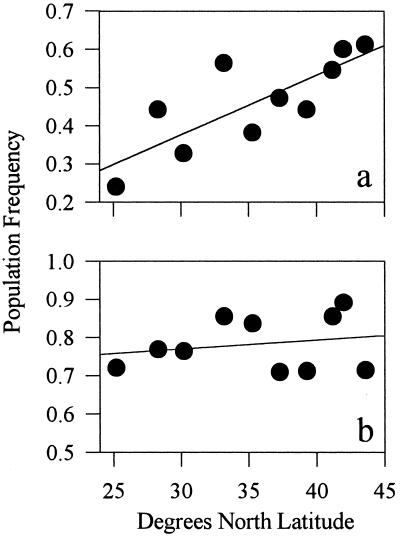
Figure 3.
Geographic variation in mth allele frequencies. (a) Frequency of the common “ATATC” haplotype vs. latitude (regression for arcsine square-root transformed data: R2 = 0.645; F = 14.29, P < 0.006). (b) Frequency of SNP site 531 vs. latitude (analysis on transformed data: R2 = 0.044; F = 0.365, P > 0.56).

