
Figure 6.
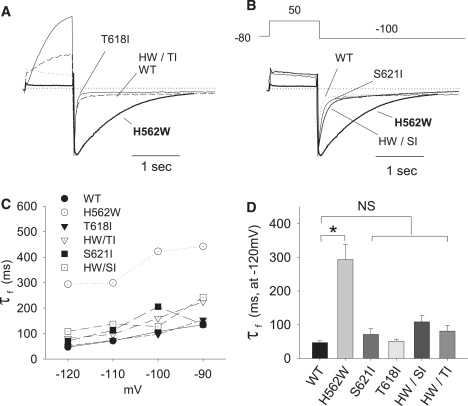
Overlay of the deactivation time course comparing the various constructs. The time courses of deactivation of the tail currents of WT-Herg, H562W, T618I, and H562W/T618I (A) as well as WT-Herg, H562W, S621I, and H562W/S621I (B) are shown after repolarization to −120 mV. The currents were normalized to have the same magnitude of peak tail currents. (C) The mean fast time constants of the deactivations for every mutation plotted against the depolarization potential. (D) The statistical analysis of the average fast time constant of the deactivations of these mutations. The time constants of the fast and slow components of deactivation are enumerated in Table 2.