
Figure 4.
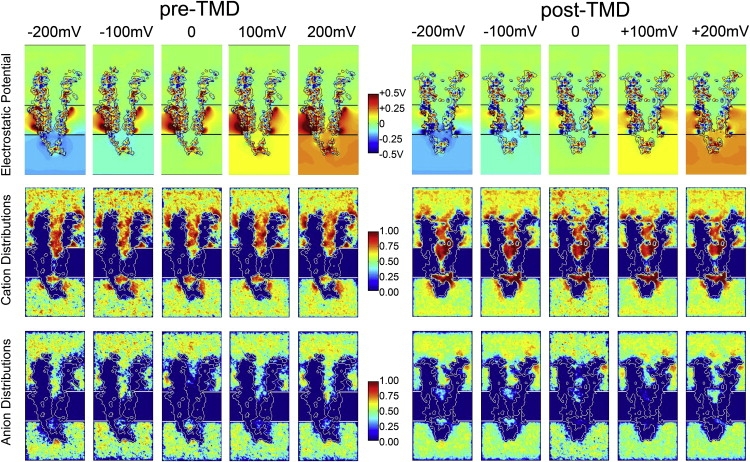
Effects of transmembrane voltage. The top row shows electrostatic potentials for each simulation computed using BioMOCA. The net transmembrane voltage difference is shown by the difference in color between extra- and intracellular compartments. The second and third rows show density distributions of cations and anions, respectively. Note that in the post-TMD simulation, cation density increases in the narrow region of the channel.