
Figure 2.
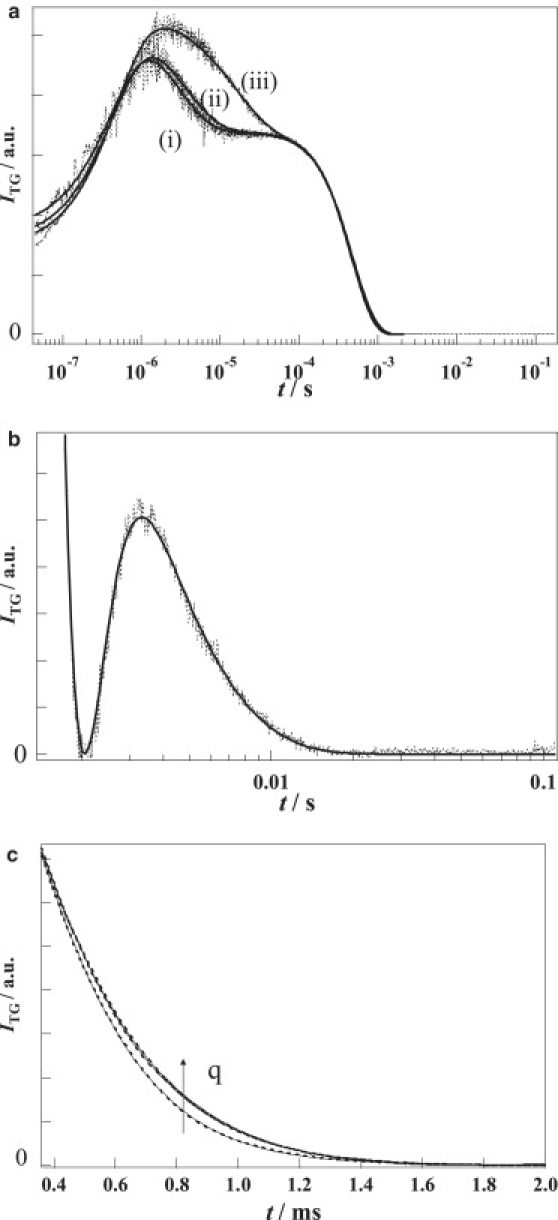
(a) Typical TG signals (dotted lines) of NpHR at [Cl−] = 300 mM at q2 = (i) 2.54 × 10¹² m−2, (ii) 1.91 × 10¹² m−2, and (iii) 4.17 × 10¹¹ m−2. The best-fitted curve by Eq. 4 is shown by the solid lines. (b) Amplified TG signal (dotted lines) on a long timescale at q2 = 2.54 × 10¹² m−2. The best-fitted curve by Eq. 4 is shown by the solid line. DP was determined from the decay rate of this part of the curve. (c) The amplified signal (dotted lines) in 0.4–1.5 ms range at various q of NpHR. q2-values were 3.80 × 10¹¹ m−2, 1.91 × 10¹² m−2, and 2.54 × 10¹² m−2. It should be noted that the signals appear to decay slower at increasing q2. The best-fitted curve using Eq. 4 is shown by the solid lines.