
Figure 3.
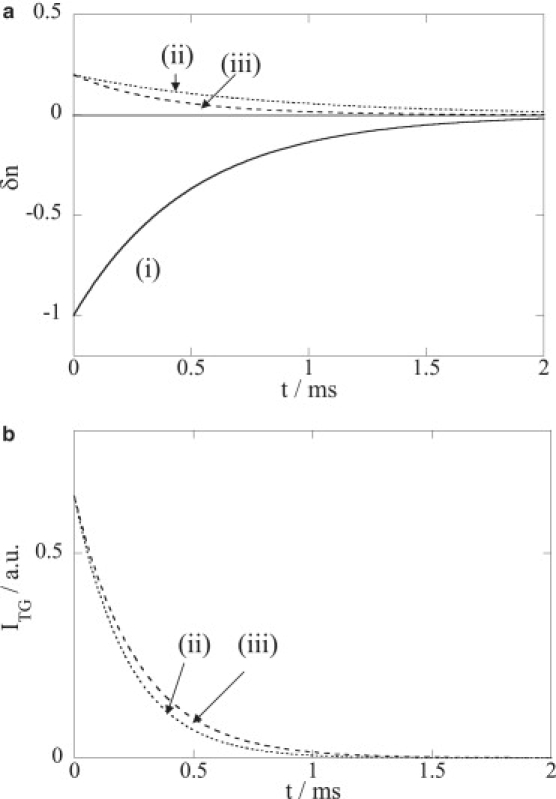
Simulated curves to explain the observed anomalous q2 dependence of NpHR. (a) The curve of (i) simulates the δn3exp(−k′3t) term of Eq. 3; (ii) (dotted line) and (iii) (broken line) are calculated curves by −0.2δn3exp(−kXt), where (ii) kX−1 = 0.7 ms,and (iii) kX−1 = 0.4 ms as representative curves at smaller and larger q2, respectively. (b) Calculated TG signals by taking the sum of (i) and (ii) (dotted line), and (i) and (iii) (broken line).