
Figure 4.
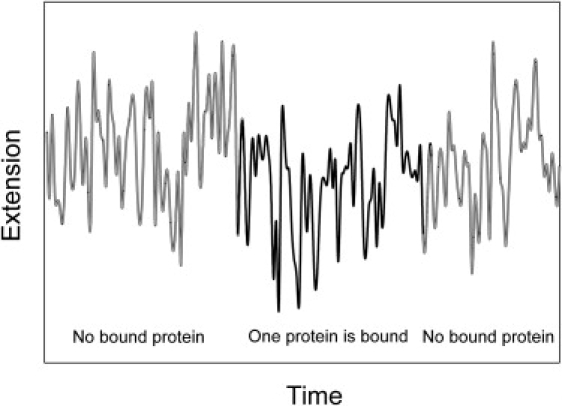
Diagram illustrating the fluctuations of DNA extension under a constant force as a function of time. The time intervals shown correspond to the DNA molecule without (gray) and with (black) bound proteins. Although the average extension is changed substantially by the protein-induced bend, there is no way to extract this shortening from the data shown, since the moments of the protein binding and dissociation are masked by the extension fluctuations. A much longer lifetime of the bound state is needed for quantitative analysis of the extension change.