
Figure 5.
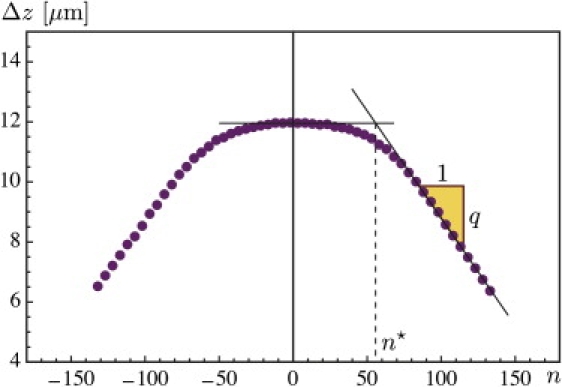
Experimental curve showing the vertical extension Δzexp of a λ-phage DNA 48-kbp molecule as a function of the imposed number of turns n, at constant force Fext = 0.44 pN. The quantity Δzth(n) defined in Eq. 12 is our prediction for the linear part of the experimental curve. The number of turns at the transition n★ and the slope q are also shown.