
Figure 2.
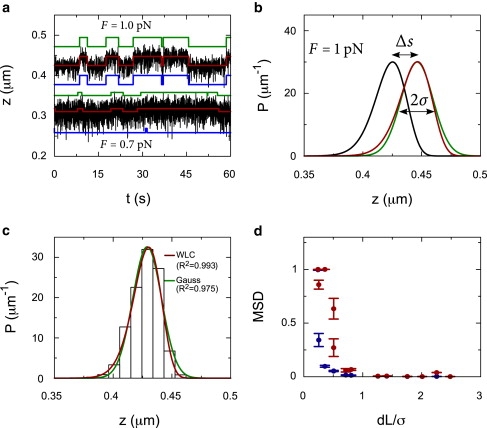
Hidden Markov fits to Brownian dynamics simulations of a DNA molecule in which transitions occur between two contour lengths. (a) Traces of simulated data (black lines), the HM fit with the WLC model (red lines), and a Gaussian model (blue lines), and the actual steps (green lines). The top trace is simulated at 1 pN for a DNA molecule, with a contour length of 500 nm, a persistence length of 52 nm, and a step of 25 nm. The bottom trace is simulated at 0.7 pN for a similar molecule, but with a step of 10 nm. (b) The WLC probability distributions for a DNA molecule at 1 pN, with a contour length of 500 nm (black line) and a contour length of 525 nm (red line). The step-size, Δs, represents the difference in end-to-end distance between the distributions. Although the width of the WLC distribution is very similar to the width of a normal distribution σ (green line), the tails of the distributions differ significantly. (c) A simulated time trace, with a constant contour length, is binned and shown as a histogram. This histogram is fit with the WLC probability distribution at 1 pN and compared to a normal distribution. The WLC distribution describes the data much better as expressed in the R2. (d) The MSD of the fits using a WLC probability distribution (blue circles) is compared to the MSD using a normal distribution (red circles) for different ratios between the step-size and the thermal fluctuations. The error bars represent the spread in the MSD for 10 different traces.