
Figure 3.
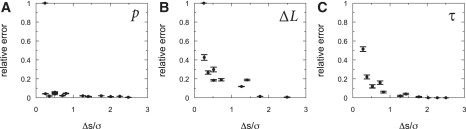
The relative errors between the HM fit and the input of the persistence length (a), step-size (b), and lifetime (c), using a WLC distribution, with respect to the ratio between step-size and thermal fluctuations. The error bars represent the spread in the relative error for 10 different traces.