
Figure 3.
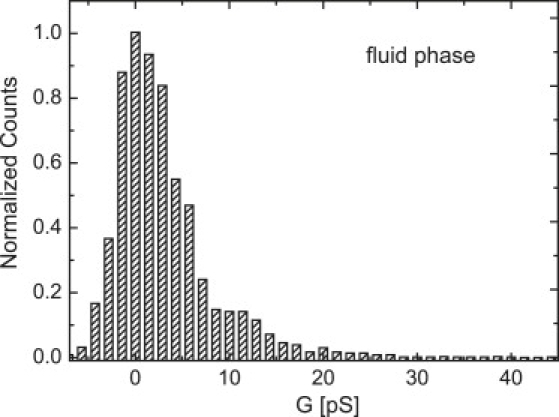
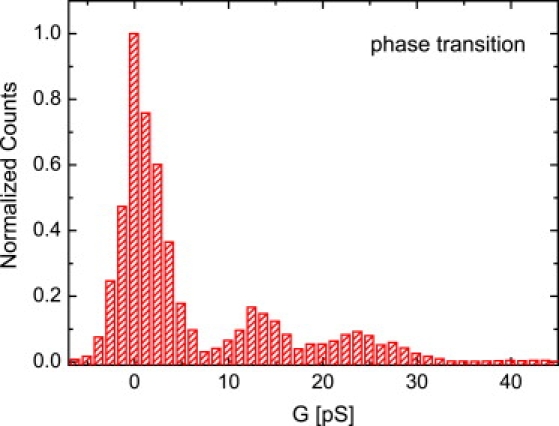
Conductivity histogram of current fluctuations in (top panel) the fluid phase (T = 33°C, VM = 100 mV) and (bottom panel) the phase transition regime (T = 31.5°C, VM = 1000 mV). The peak at G = 0 pS corresponds to the baseline. In the fluid phase, no significant peaks appear. In the phase transition regime, distinct maxima around G = 12 pS and G = 24 pS appear, with some additional substructure around G = 20 and G = 27 pS. Data were collected from three individual bilayers by analyzing a 200 s long trace. The observed maxima agree in all measurements within a range of 20%.