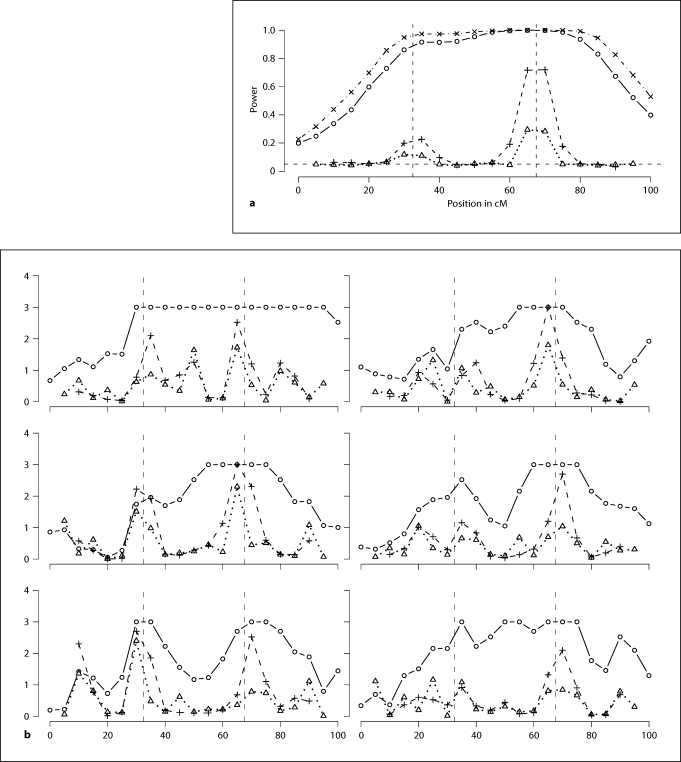
Fig. 5.
a Powers of the marginal tests and the conditional tests, nominal level α = 0.05. b −log p values of the marginal tests and the conditional tests for 6 randomly chosen data sets. Two vertical dashed lines correspond to the two causal loci τ1 and τ2. The horizontal dashed line in a corresponds to α = 0.05. Solid line with circles: marginal tests. Dotted line with triangles: tests conditional on Sj − 1 and Sj + 1. Dashed line with pluses: tests conditional on Sj − 2 and Sj + 2. In a, dot-dashed line with crosses: powers corresponding to SOLAR LOD scores.

