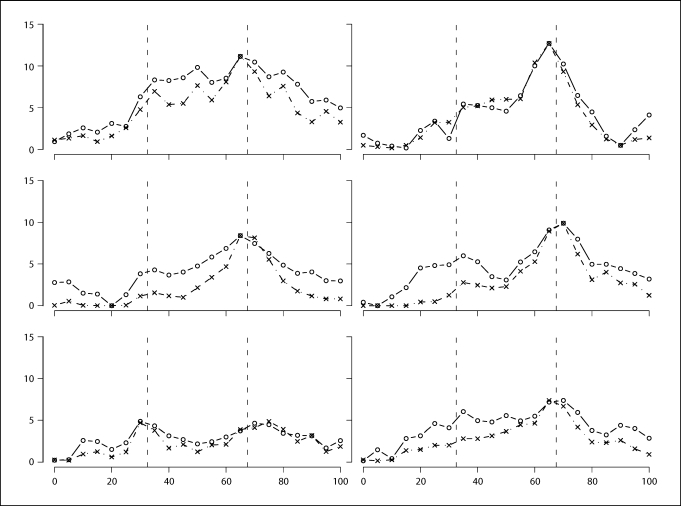
Fig. 6.
Comparing log w-scores to SOLAR LOD scores. The data sets correspond to figure 5b. The y-axis is on the LOD score scale. The log w-scores were linearly transformed so that they have the same range as the LOD scores. Solid line with circles: log w-scores. Dot-dashed line with crosses: SOLAR LOD scores.

