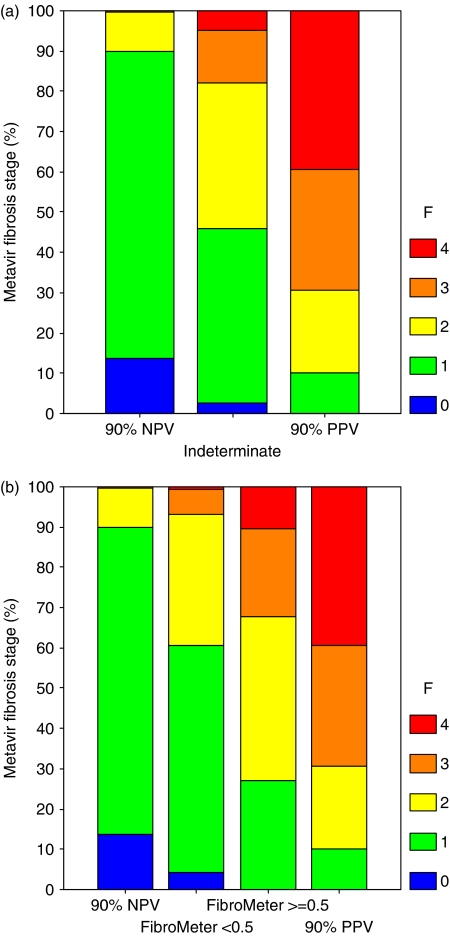
Fig. 4.
Proportions of Metavir fibrosis stage (F) according to thresholds of ≥90% negative (NPV) and positive predictive values (PPV) with a single indeterminate interval for significant fibrosis with FibroMeter (a). (b) The previous indeterminate interval was divided according to diagnostic cut-off at 0.5, providing two new intervals between this cut-off and the thresholds of predictive values: second interval between 90% NPV threshold and diagnostic cut-off; third interval between diagnostic cut-off and 90% PPV threshold.

