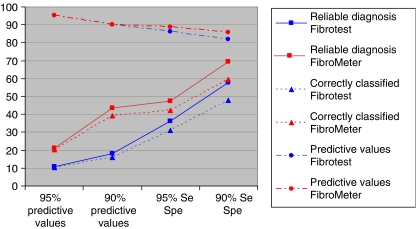
Fig. 5.
Rate (% of the whole population) on y-axis of patients with reliable diagnoses (squares), correctly classified patients (triangles) and resulting observed predictive values (PV) (circles) according to two intervals of reliable diagnosis defined by different predetermined thresholds (90 and 95%) of diagnostic indices (PVs, sensitivity (Se), specificity (Spe)) on x-axis for significant fibrosis by Fibrotest (blue) and FibroMeter (red).

