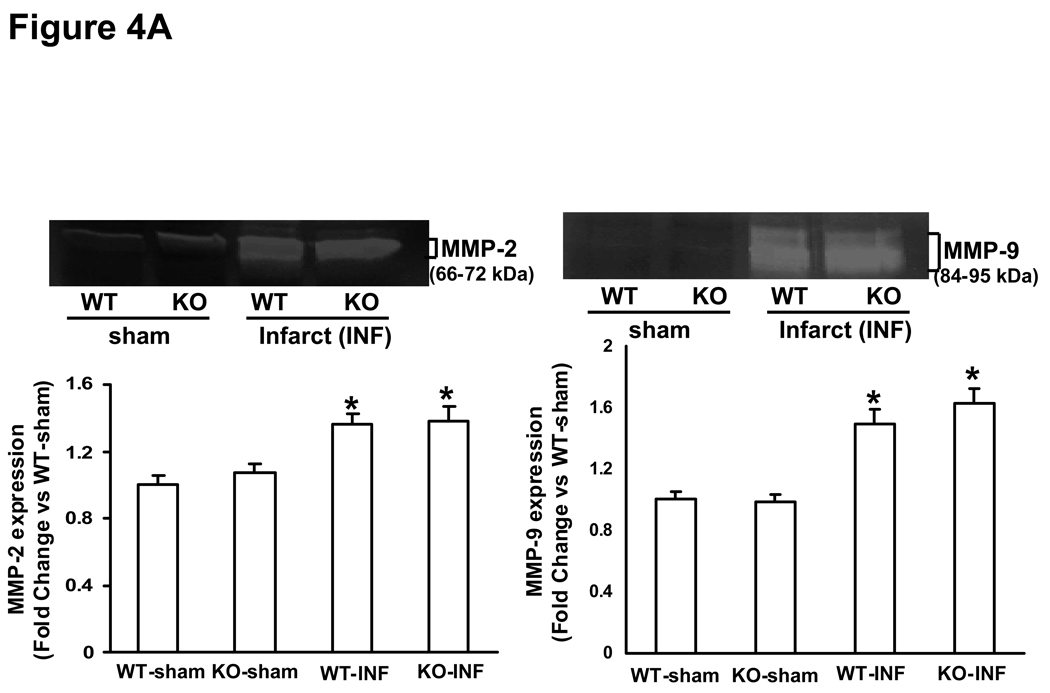
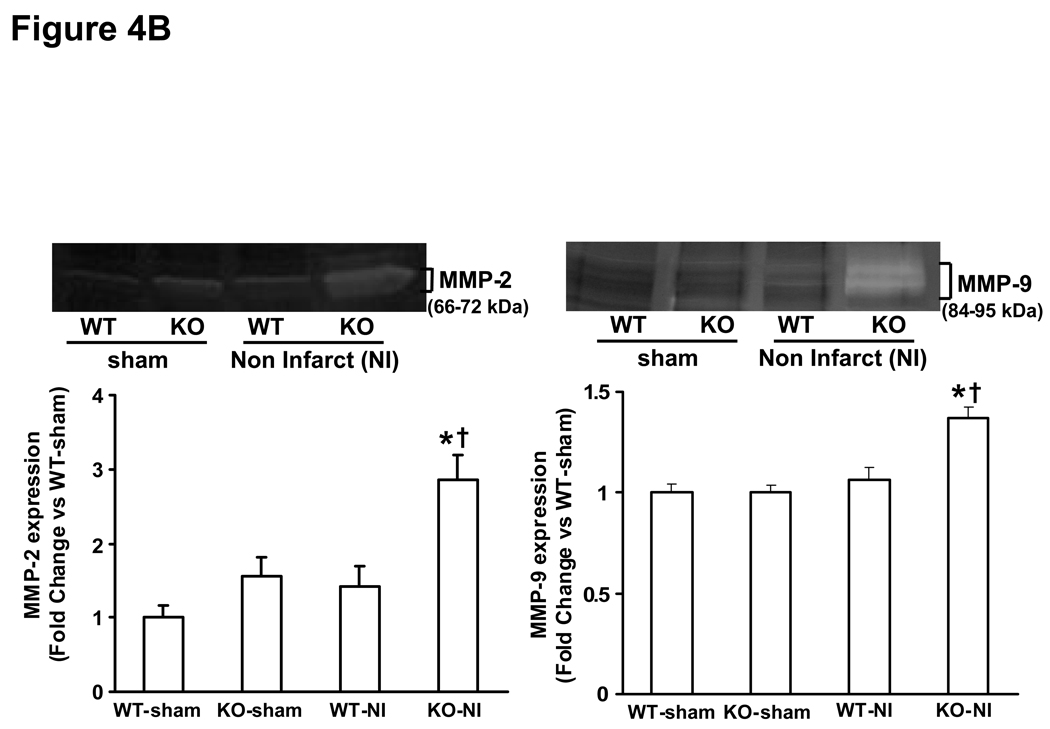
Figure 4.
A. Gelatin in-gel zymography of infarct area of LV tissue 3 days post-MI. The lower panel exhibits the mean densitometry values for MMP-2 (left) and MMP-9 (right). MMP-2 and MMP-9 was higher in MI groups as compared to sham groups, *P<0.05 vs sham; n=3. B. Gelatin in-gel zymography of non-infarct area of LV tissue 3 days post-MI. The lower panel exhibits the mean densitometry values for MMP-2 (left) and MMP-9 (right). MMP-2 and MMP-9 was higher in KO-NI group as compared to WT-NI and sham groups. MMP-2, *P<0.05 vs sham, †P<0.05 vs WT-NI; MMP-9, *P<0.01 vs sham, †P<0.05 vs WT-NI; n=3.


