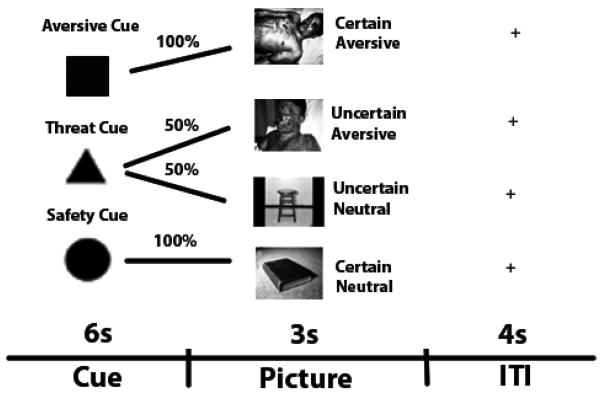
Figure 1.
Diagram of the task. Participants received one of three cues; an ‘aversive’ cue indicated than an aversive picture will appear (1.0 probability); a ‘safety’ cue signified that the participants would see a neutral (certain) picture (1.0 probability). a ‘threat’ cue indicated that either an aversive (0.5 probability, unknown to participants), or neutral picture (0.5 probability) might appear.

