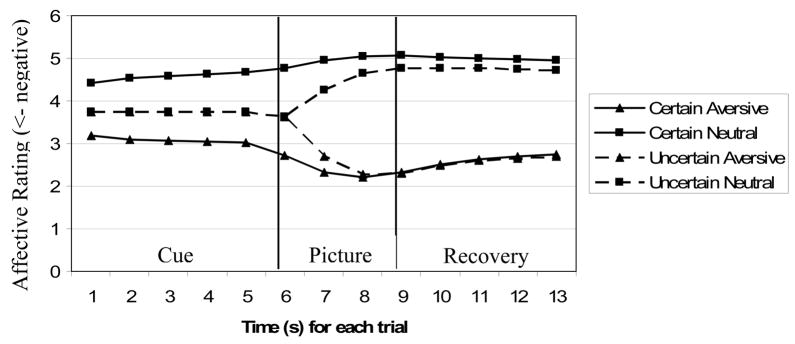
Figure 2.
Ratings for each trial type across the entire length of the trial (13 seconds in 1 sec bins). Lower values on the Y axis signify more negative affective ratings. The points on each line are significantly different from the corresponding points on all other lines except for time bins 8 – 13 for the Aversive trials (uncertain and certain). Lower values on the Y axis signify more negative affective ratings.

