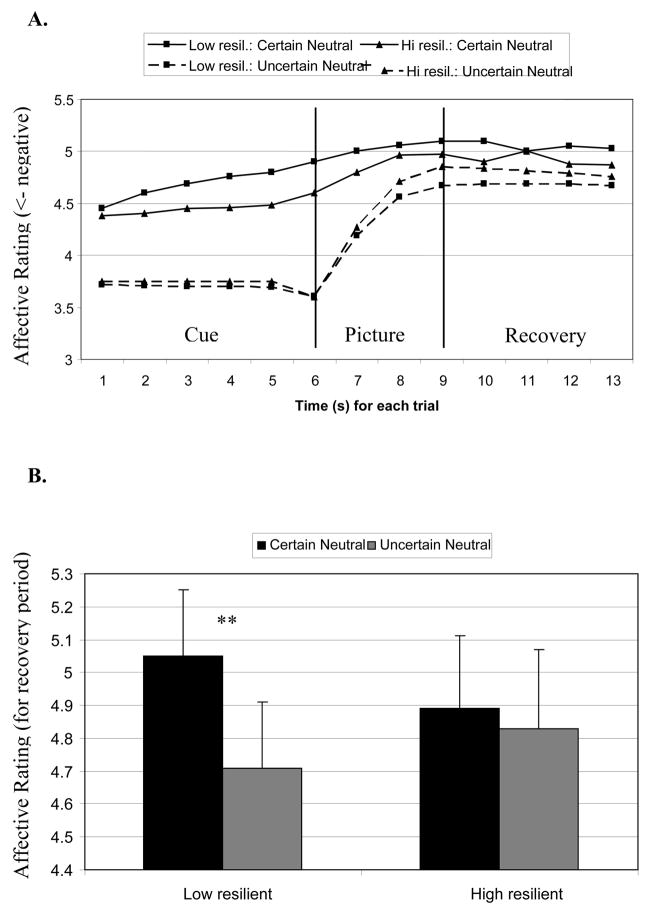
Figure 3.
A. Resilience differences in the neutral trials across all time bins. High resilient show greater recovery as measured by a smaller difference between uncertain and certain neutral trials during the recovery period. B. Mean responses during the recovery period for the neutral trials. The difference between neutral trials for low resilient participants is significant (p < .001), and interaction between resilience and Certainty of neutral picture is also significant (p < .05).

