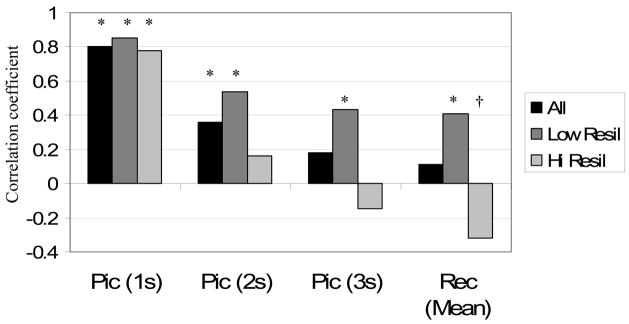
Figure 4.
Correlation coefficients between anticipation (safety – threat cues) and picture response (certain – uncertain; for each second of the picture period, and the mean of the recovery period) for all participants, and then high and low resilient participants separately. Note how correlations between anticipation and picture response remain high throughout the trial for low resilient participants, but not for high resilient participants (* p < .05, † p < .1).

