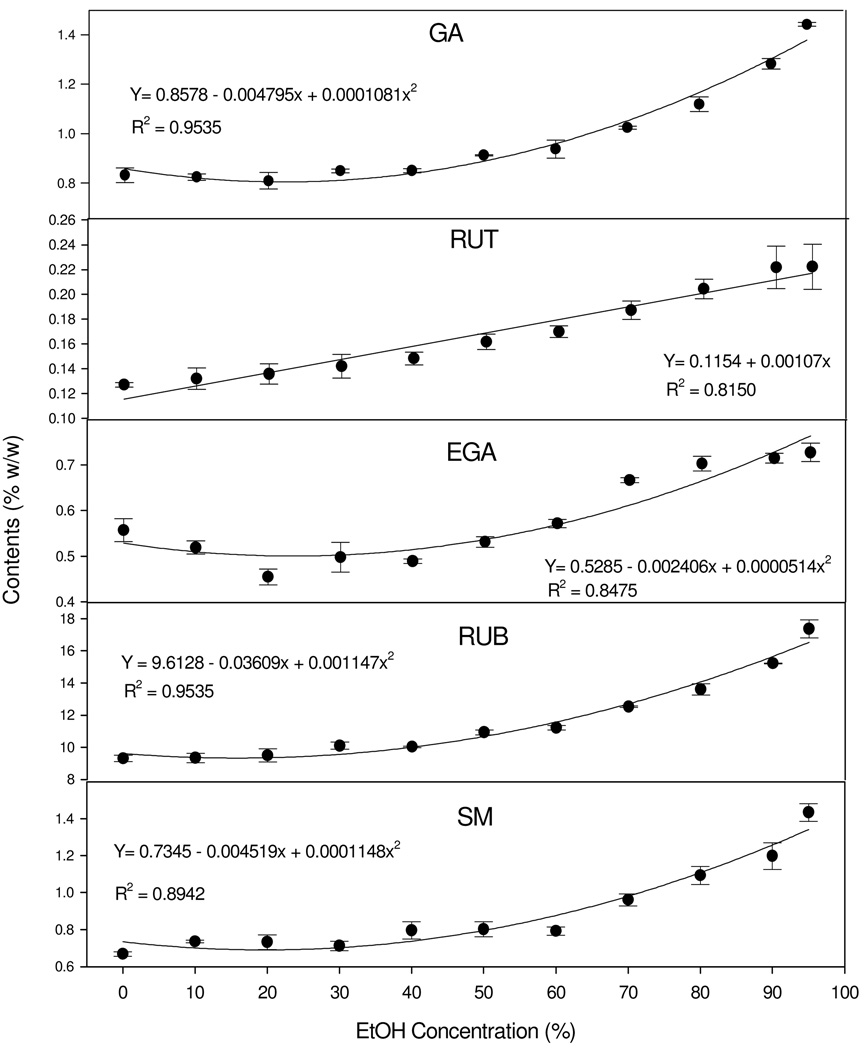
Fig. 3.
Changes of each marker compound in the purified extract (supernatant) corresponding to ethanol concentrations in the AP experiments. A simple linear regression model was fitted for RUT. Quadratic linear models were fitted for the contents of GA, EGA, RUB, or SM. All values are expressed as mean ± standard error (n=3).

