
Figure 2.
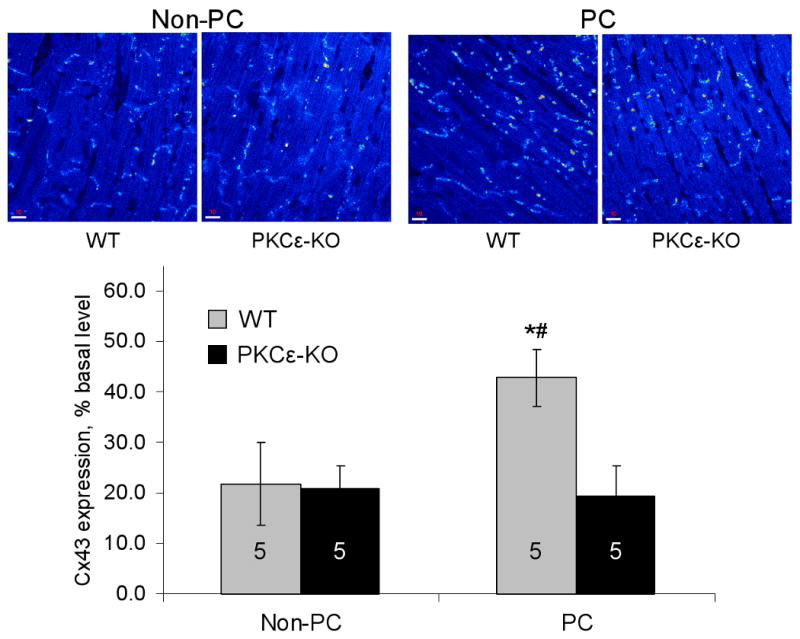
Top: Representative confocal microscopy images showing Cx43 signal at cell-cell junctions in wildtype (WT) and PKCε-KO hearts subjected to 30 min ischemia without (Non-PC) or with preconditioning (PC). Bottom: Quantitative confocal microscopy measurements showing amount of Cx43 signal as a percent of total tissue area. Values are expressed as percent of basal values to account for differences in basal Cx43 signal between WT and PKCε-KO animals; n for each group indicated in bar. *p<0.001 vs. WT non-PC; #p<0.001 vs. PKCε-KO PC.