Figure 6.
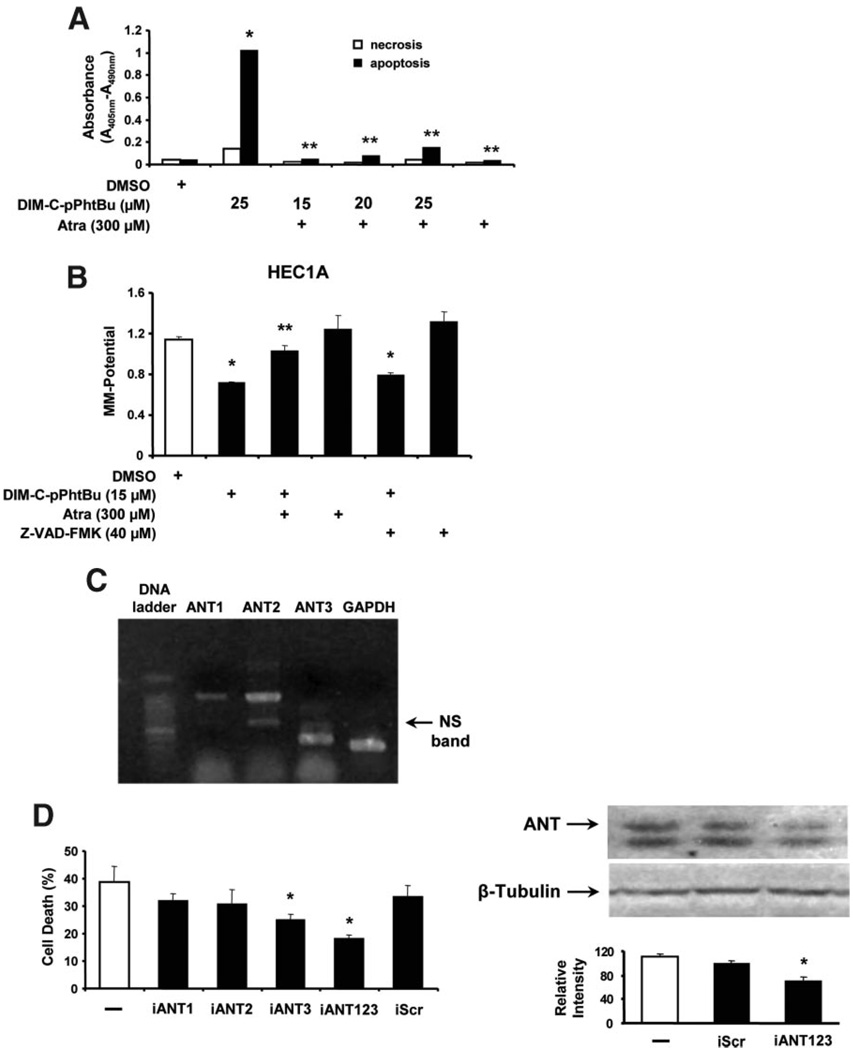
Role of ANT protein in DIM-C-pPhtBu-induced cell death and decreased MMP. (A) Cell death ELISA. HEC1A cells were treated with DMSO, Atra, DIM-C-pPhtBu alone, or in combination, and necrosis/apoptosis was determined in an ELISA assay (in duplicate) as described in the Section ″Materials and Methods.″ Significant induction of apoptosis (*) and inhibition after cotreatment with Atra (**) are indicated. (B) Effects of Atra on decreased MMP induced by DIM-C-pPhtBu. HEC1A cells were treated with DMSO, DIM-C-pPhtBu, Atra, Z-VAD-FMK or combinations, and MMP was determined using the fluorescence JC-1 probe as described in the Section ″Materials and Methods.″ Significantly (P < 0.05) decreased MMP (*) induced by DIM-C-pPhtBu and inhibition by Atra (**) are indicated. Results in (A) and (B) are expressed as mean ± SE for three replicate determinations for each treatment group. (C) Expression of ANT mRNA levels. Expression of ANT1, ANT2, and ANT3 mRNA was determined by RT-PCR from RNA isolated from HEC1A cells as described in the Section ″Materials and Methods.″ GAPDH served as a reference control. Effects of ANT knockdown on the percentage of DIM-C-pPhtBu-induced dead cells. (D) Effects of ANT knockdown on DIM-C-pPhtBu-induced cell death. HEC1A cells were transfected with iANT1, iANT2, iANT3, or their combination, and cells were treated with 10 µM DIM-C-pPhtBu alone or in combination with iScr or siRNAs for ANT. The percentage of dead cells was determined after 48 h as described in the Section ″Materials and Methods.″ ANT protein expression in HEC1A cells transfected with siRNAs was determined by Western blot analysis as described in the Section ″Materials and Methods.″ Significant (P < 0.05) inhibition of cell death and ANT protein expression is indicated by an asterisk (*).

