Figure 6.
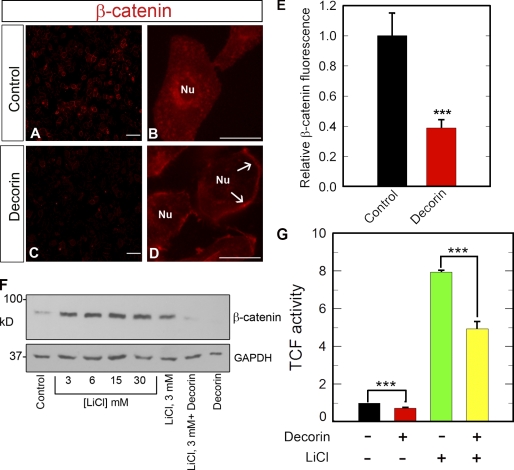
Decorin attenuates β-catenin levels and transcriptional activity. (A–D) Representative β-catenin immunofluorescence images of HeLa cells after a 2-h incubation with or without 100 nM decorin. Notice the marked decline in β-catenin levels throughout the cytoplasm and perinuclear regions in the decorin-treated cells. In contrast, the plasma membrane localization of β-catenin increases (D, arrows). Nu, nucleus. Bars: (A and C) 50 µm; (B and D) 10 µm. (E) Quantification of the fluorescence intensity of images similar to those shown in A and C. The values represent the mean ± SEM of 12 images (∼120 cells/image) from four independent experiments. (F) Decorin inhibits β-catenin activity via a GSK3-β–independent mechanism. Representative β-catenin immunoblot of HeLa lysates treated with 100 nM decorin for 6 h in the presence or absence of 30 mM of the GSK3-β inhibitor LiCl. Cells were preincubated with LiCl for 1 h in full serum before decorin treatment. Glyceraldehyde-3-phosphate dehydrogenase (GAPDH) was used as a loading control. (G) HeLa cells were cotransfected with the TopFlash vector and a vector carrying the R. reniformis luciferase. 12 h after transfection, cells were treated with or without 100 nM decorin or LiCl for 6 h. Luciferase activity was measured after incubation with the cognate substrate luciferin. The values were normalized on R. reniformis luciferase activity. Cells preincubated with 30 mM LiCl, as in F, showed the same degree of reduction in luciferase activity when treated with decorin. Notice that LiCl enhances β-catenin activity (***, P < 0.001). The values represent the mean ± SEM of five independent experiments performed in triplicate. TCF, T cell factor.

