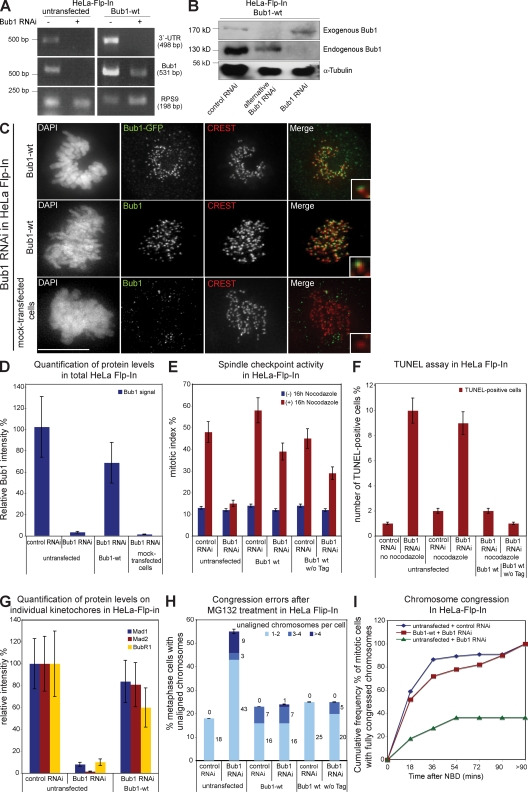
Figure 2.
Bub1-Flag-EGFP wt complements Bub1 RNAi. (A) RT-PCR of a region within the 3′ UTR of Bub1, a region within the ORF of Bub1, and the housekeeping gene RPS9. (B) Immunoblot of lysates of Bub1-wt cells treated with RNAi as indicated and probed with Bub1 and α-tubulin antibodies. (C) Immunofluorescence images of mitotic cells stained with DAPI (DNA), GFP, or Bub1 antisera (green) and CREST antisera (red, kinetochores). Bar, 10 µm. (D) Quantification by immunofluorescence of Bub1 levels in total cells. (E) Mitotic index of the indicated cells treated with or without nocodazole for 16 h. (F) Quantification of TUNEL-positive cells after nocodazole and Bub1 RNAi. (G) Quantification by immunofluorescence of Mad1, Mad2, and BubR1 levels on kinetochores. (H) Cumulative plot of percentage of metaphase cells with unaligned chromosomes after a 1-h MG132 treatment. (I) Cumulative frequency plots of chromosome alignment time using nuclear breakdown (NBD) as t = 0. Insets show a higher magnification view of a single kinetochore. Error bars represent standard deviation.

