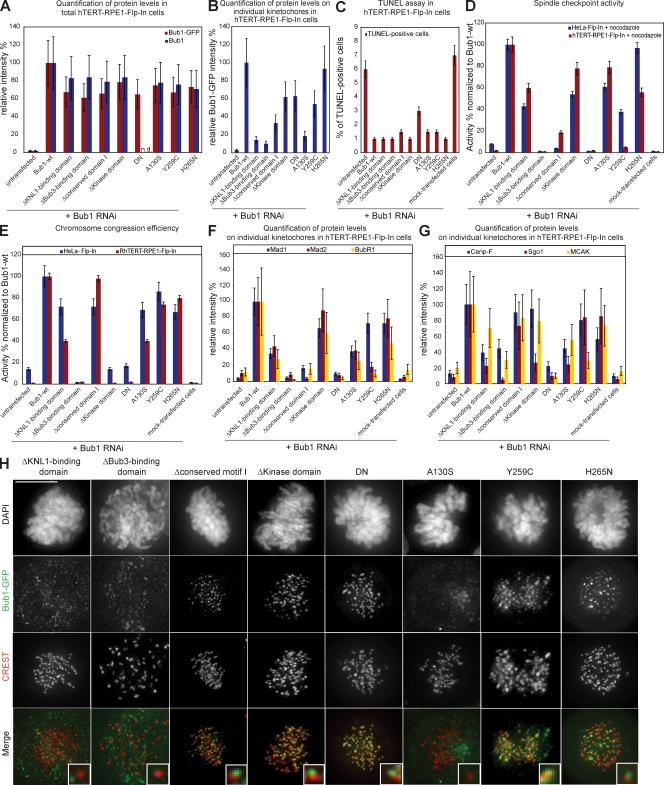
Figure 9.
The hTERT-RPE1 Bub1 mutant cells behave in a manner similar to HeLa cells. (A) Quantification by immunofluorescence of total Bub1 mutant levels using Bub1 and GFP antibodies. (B) Quantification by immunofluorescence of Bub1 mutant levels on kinetochores using GFP antibodies. (C) Quantification of TUNEL-positive cells after nocodazole treatment and Bub1 RNAi. (D) Comparison of mitotic index of Bub1 mutant HeLa and hTERT-RPE1 cells treated for 16 h with nocodazole normalized to Bub1-wt. (E) Comparison of the ability to complement congression errors in Bub1 mutant HeLa and hTERT-RPE1 cell lines treated for 1 h with MG132 normalized to Bub1-wt. (F) Quantification by immunofluorescence of Mad1, Mad2, and BubR1 levels on kinetochores. (G) Quantification by immunofluorescence of CENP-F, Sgo1, and MCAK levels on kinetochores. (H) Immunofluorescence images of mitotic cells stained with DAPI (DNA), GFP antisera (green), and CREST antisera (red, kinetochores). Insets show a higher magnification view of a single kinetochore. Error bars represent standard deviation. Bar, 10 µm.

