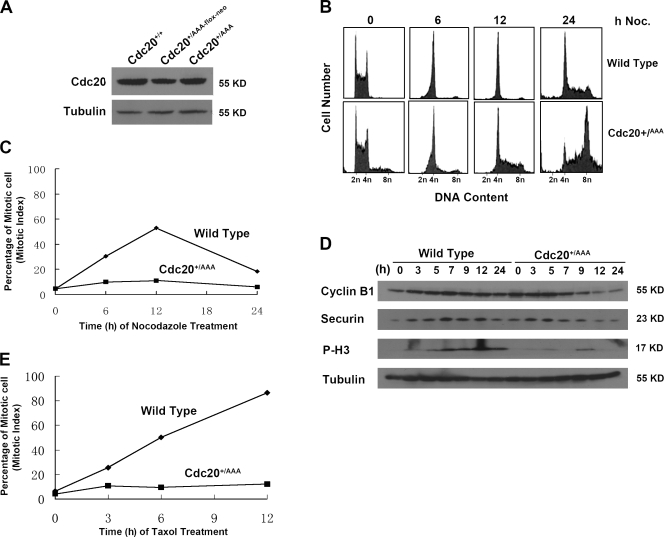
Figure 2.
Cdc20AAA disrupts SAC. (A) Western blot analysis of Cdc20 expression. (B) FACS profiles of the cells treated with 80 nM nocodazole (noc). (C) Mitotic indices of the cells in A. (D) Western blot analysis of the cells treated with nocodazole for various lengths of time. P-H3, phosphorylated histone 3. (E) Mitotic indices of the cells treated with 100 ng/ml taxol.

