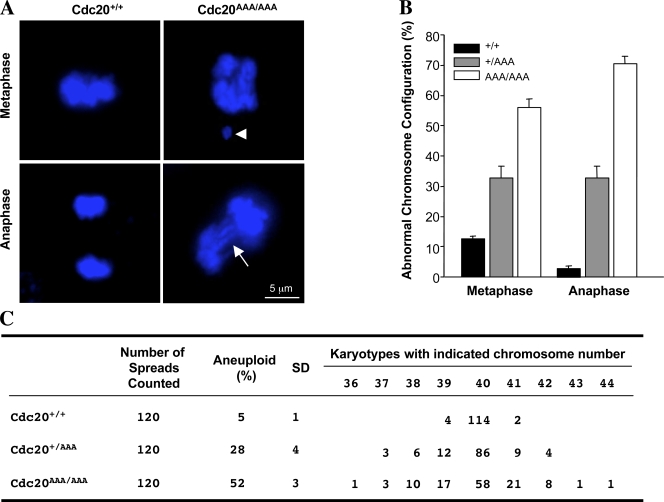
Figure 5.
Aberrant mitoses and aneuploidy in the mutant MEFs. (A) Representative images of mitotic cells. DNA was visualized with DAPI staining. The arrowhead indicates a DNA mass drifted far away from the bulk, and the arrow indicates anaphase bridges. (B) Quantitation of abnormal mitoses. (C) Karyotype analysis is shown. Error bars indicate SD.

