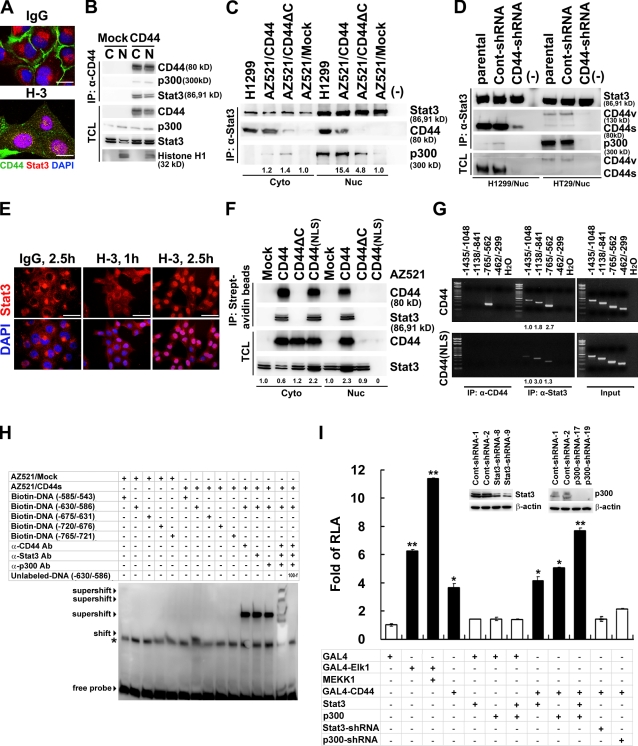
Figure 4.
Nuclear CD44 associates with STAT3 and functions to modulate transcription. (A) Confocal microscopy of H1299 cells cultured in serum-free medium for 24 h and treated with control IgG or H-3 for 1 h. (B) Nuclear (N) and cytosolic (C) fractions were prepared from AZ521/mock and AZ521/CD44 cells and immunoprecipitated followed by Western blotting. (C) Nuclear (Nuc) and cytosolic (Cyto) fractions were immunoprecipitated followed by Western blotting. (D) Nuclear extracts were prepared from the parental H1299 and HT29 cells or cell clones stably harboring lentivirus-encoded control (Cont) shRNA or shRNA targeting CD44 and immunoprecipitated followed by Western blotting. (E) Confocal microscopy of AZ521/CD44 cells with anti-STAT3 (in red) after incubation with control IgG or H-3 for 1 and 2.5 h. (F) AZ521/CD44 cells were incubated with biotin-conjugated H-3 at 4°C. After removal to 37°C for 1 h, cytosolic and nuclear fractions and immunoprecipitates from streptavidin beads were analyzed by Western blotting. (G) Nuclear extracts were prepared from AZ521/CD44 (top) and AZ521/CD44(NLS) mutant (bottom) cells after cross-linking with 1% formaldehyde. ChIP was performed using anti-CD44 and anti-STAT3. PCR amplification of designated regions within cyclin D1 promoter was performed. (H) Nuclear extracts were prepared from AZ521/mock and AZ521/CD44s cells cultured in serum-free medium for 24 h. EMSA was performed with biotin-labeled double-stranded oligonucleotide probes corresponding to various regions of cyclin D1 promoter in the presence and absence of anti-CD44, anti-STAT3, or anti-p300 antibodies. Shifted and supershifted complexes are indicated by arrowheads. A nonspecific band is indicated by an asterisk. Ab, antibody. (I) Reporter assays were performed in AZ521 cells and AZ521 cell clones stably harboring lentivirus-encoded control shRNA or shRNA targeting STAT3 or p300 using the pFR-Luc reporter plasmid containing five copies of GAL4 DNA–binding sites. Data are presented as the means ± SD and were derived from at least three independent experiments. *, P < 0.05; and **, P < 0.01 by Student's t test. RLA, relative luciferase activity; TCL, total cell lysate. (C, F, and G) The relative intensities of the bands, which were quantified by densitometry, are shown. Bars: (A) 10 µm; (E) 25 µm.

