
Figure 3.
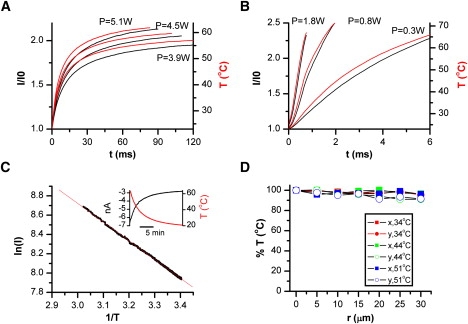
Experimental calibration. Temperature at the beam center was monitored by conductance changes of an open pipette. (A and B) Temperature after irradiation at (A) 980 nm or (B) 1460 nm. Different traces in each plot corresponding to different output powers. Pipette current is shown in black, whereas the calibrated temperature is in red/grey. The pipette was held at 30 mV. For a given current I, the temperature was calculated by T = [1/T0 − R/Ea × ln(I/I0)]−1 where R is the gas constant, Ea the activation energy of electrolyte, and T0 and I0 are respectively the base (room) temperature and the corresponding electrode current. (C) Arrhenius plot of electrode current. For measurement, the chamber solution was preheated to ∼60°C and then passively cooled while the temperature of the solution was recorded simultaneously with the pipette current using a thermistor immersed in the chamber (inset shows an example of recordings). The Arrhenius plot was linear over the tested temperatures (23°C to 60°C). The slope of the plot gave an average Ea = 3.84 ± 0.09 kcal/mol (n = 20) for the control bath solution. (D) Spatial variation of temperature within the beam at 1460 nm. The tip of an open pipette was moved radially away from the beam center while the temperature at each spot was measured. The average deviation was <5% at r ≤ ±10 μm, a radius larger than a typical HEK293 cell.