
Figure 4.
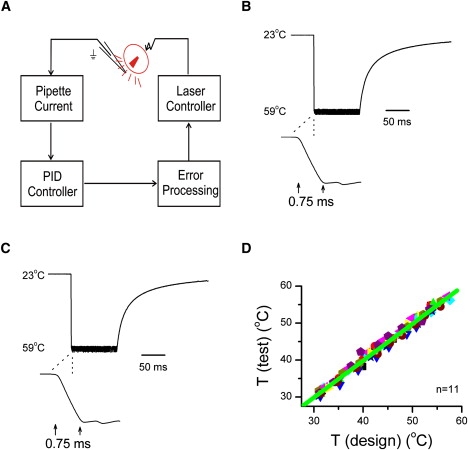
Implementation of constant temperature jumps. (A) A diagram of the feedback control. The diode current was modulated so that the current of an open pipette approximated a step response. The diode was initially pulsed on for a brief duration to reach the set point and was subsequently switched on and off to hold the electrode current to be constant. (B) An example of a constant temperature jump (shown as recorded current filtered at 2 kHz) from 23°C to 59°C in ∼0.75 ms and maintained constant for 100 ms. Shown below is an expanded view of the rising phase. Within, the pulse temperature had a standard deviation σ = 0.8°C at 59°C (σ/T = ∼1%). (C) Repeatability of constant temperature jumps. The temperature jump was recorded using a new electrode and stimulated with prerecorded pulse protocol. (D) Correlation plot of test temperatures against temperatures in the initial design, showing reproducibility over a broad range (δT/T ≤ 0.5%, n = 11).