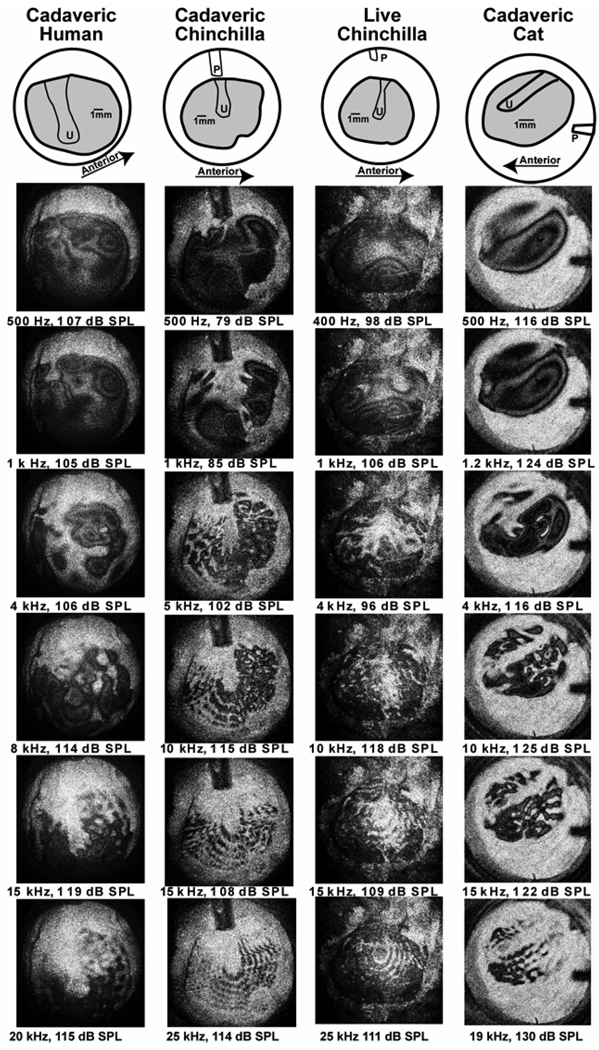
Figure 4.
Time-averaged holograms measured in four specimens: the left-handed column contains TAHs measured in cadaveric humans, the next in cadaveric chinchilla, the third from the left in live chinchilla, and the right-hand column in cadaveric cat. The top row contains cartoons showing the exposed area of the TM (in gray), the location of the handle of the malleus on the medial surface of the imaged TMs, the umbo (U) and the probe tube. The scale bars show a 1 mm length in each image. The TAHs are arranged from top to bottom in order of the sound frequency of the stimulus. The rows group similar stimulus frequencies.

