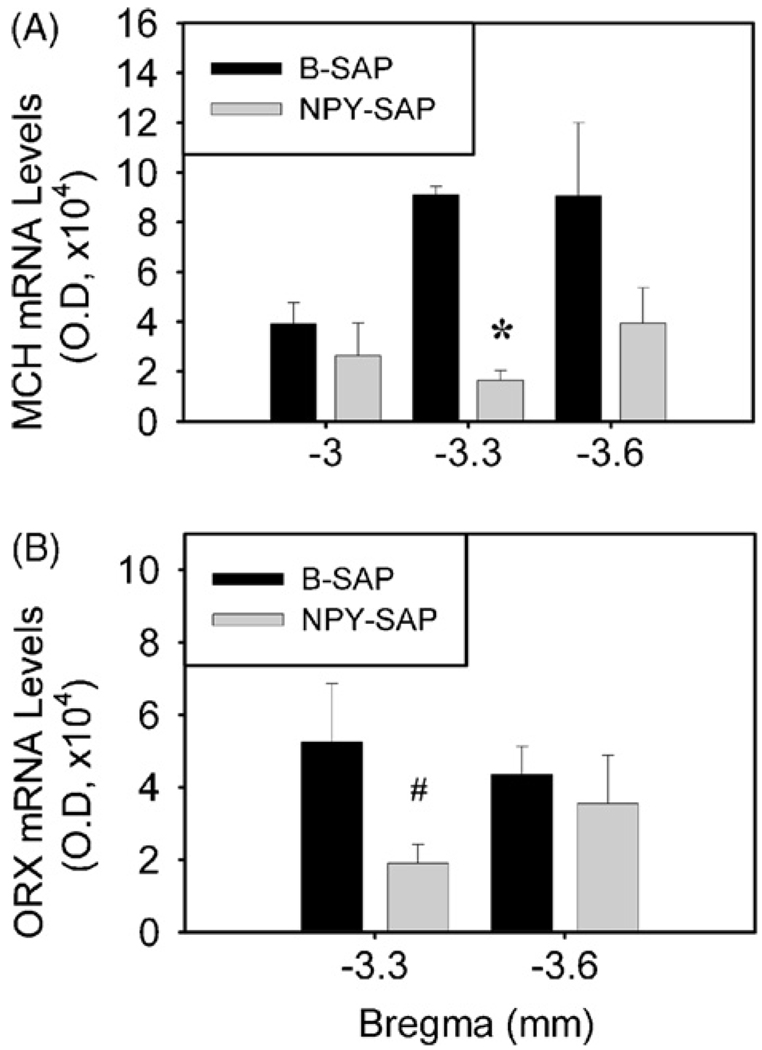
Fig. 5.
Expression of MCH and ORX mRNAs in the LHA, as determined by quantitative analysis of optical density. Panel (A) shows MCH mRNA expression at 3, 3.3 and 3.6 mm caudal to bregma. Panel (B) shows ORX mRNA expression at 3.3 and 3.6 mm caudal to bregma. #P < 0.05; *P < 0.01 (n = 3–5 rats for each group; unpaired t test; vs. B-SAP-infused rats).

