
Figure 2.
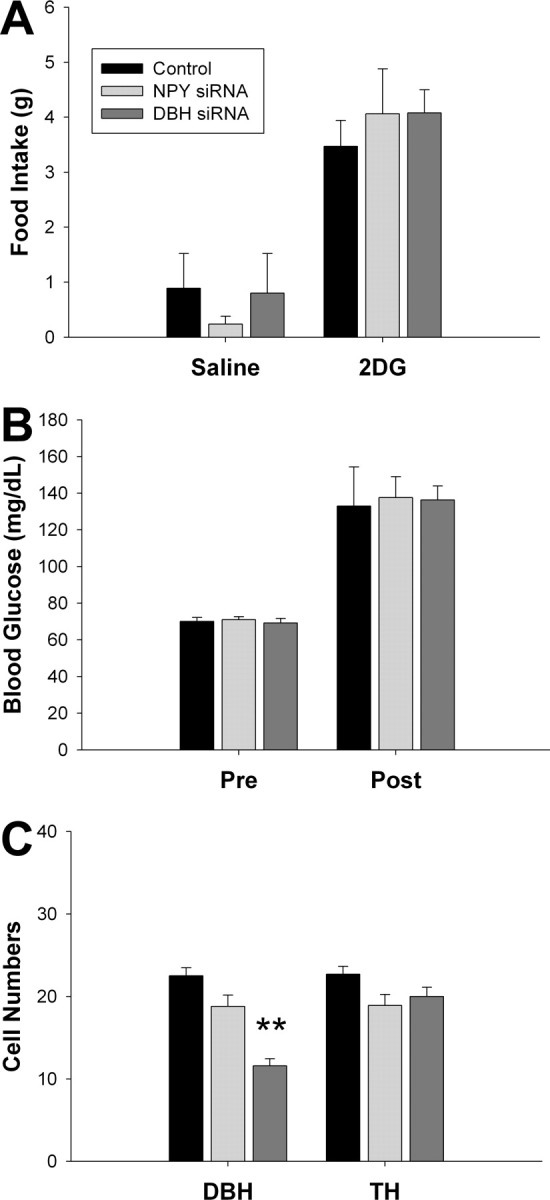
Effect of single siRNA injection on glucoprivic responses and target gene expression. A shows the effect of NPY siRNA, DBH siRNA, or control ntRNA injected bilaterally into A1/C1 (0.02 nmol/side), on 4 h saline- or 2DG (200 mg/kg)-induced feeding. Food intake was increased significantly above saline baseline by 2DG, but there were no significant between-group differences either in the response to 2DG or in baseline feeding. B shows effects of the same treatments on 2DG-induced hyperglycemia. Blood glucose was measured 15 min before (Pre) and 90 min after (Post) 2DG injection. Blood glucose levels were significantly increased above baseline by 2DG, but there were no significant differences between groups. C, Numbers of DBH- and TH-positive cells in A1/C1 as determined by quantification of IHC. Data were obtained from rats used in the above feeding and blood glucose tests. DBH siRNA significantly inhibited DBH expression, but not TH expression, in A1/C1 region. **p < 0.001 (vs control).