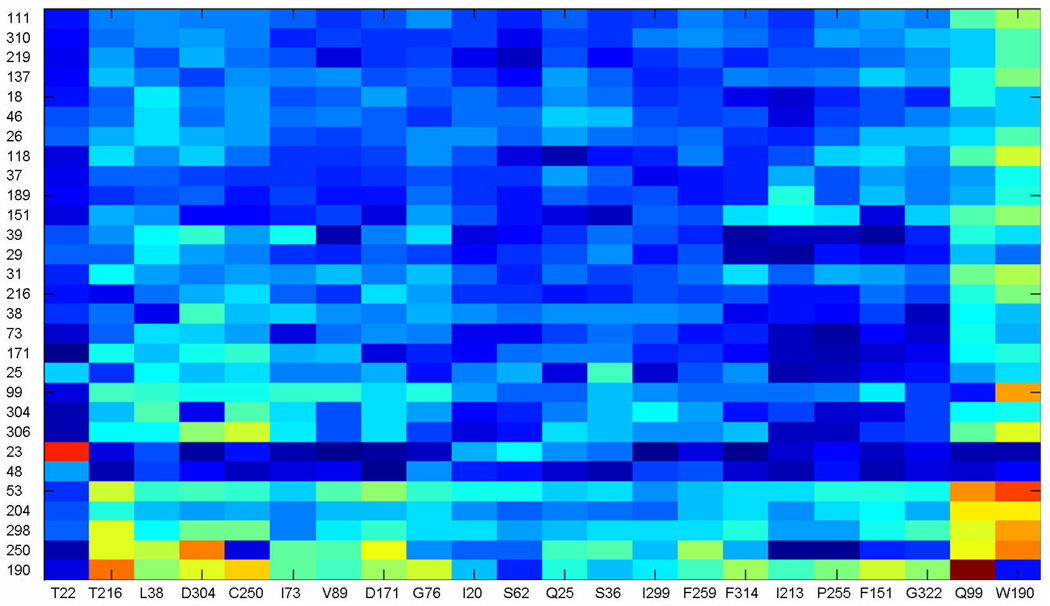
Figure 6.
SCA matrix after cluster analysis. For each possible perturbation ΔΔGstat were calculated in each position in the MSA, according to the defined criteria (see Materials and Methods), which generated a NxM matrix, where the N are the number of perturbations and M the number of positions in the MSA. The initial matrix was used in iterative rounds of cluster analysis in MATLAB. In each round, the positions in the matrix with significant ΔΔGstat values were kept and the ones with small signal, discarded. The final matrix is shown, with the perturbations given as columns and positions of the MSA as rows. The color scale range from dark blue for small values to bright red for high ΔΔGstat values.

