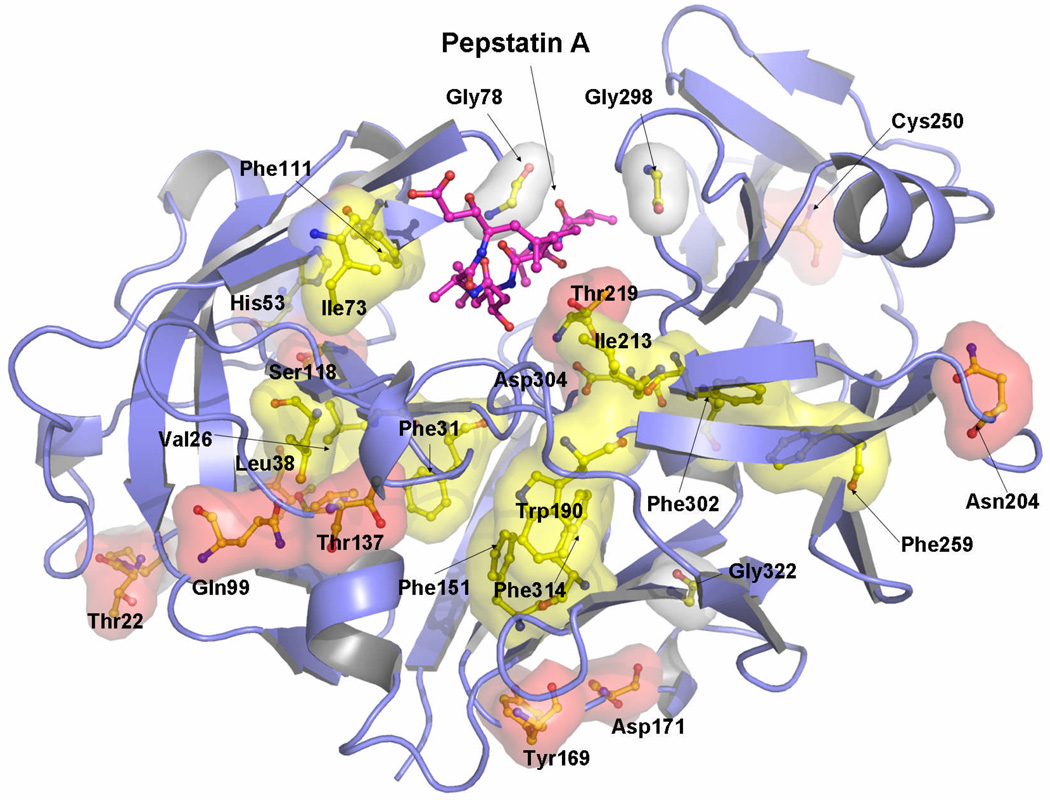
Figure 7.
Coupled positions maped onto the crystal structure of TrAsP. The residue surfaces were computed and showed using the program PYMOL.50 Hydrophobic residues are shown in yellow surface, polar residues in red, a histidine (His53) in blue, and glycines and prolines in white surface.

