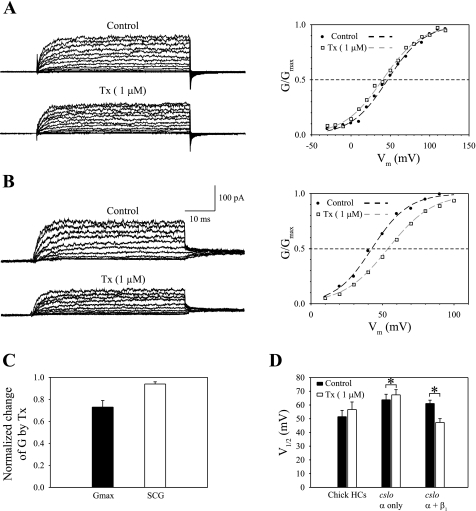
Fig. 4.
Overall, tamoxifen had an insignificant effect on BK channel activation in ensemble-averaged recordings. A, left: activation currents are shown for one outside-out patch excised from a hair cell 1.14 mm DAE. The patch was perfused with control saline (top) and 1 μM Tx (bottom). The holding voltage was −20 mV. Activation steps ranged from −40 mV to 120 mV, followed by a deactivation step to −20 mV. Current traces were averaged from 30 stimulus presentations. A, right: conductance-voltage (G-V) curves were constructed from steady-state activation currents for control and drug conditions and normalized to maximum conductance level (Gmax). Normalized G-V curves were fit to a first-order Boltzmann function (dashed lines). The fit parameters are as follows: for control saline, Gmax = 1.11 nS, z = 1.08, and V1/2 = 46.7 mV; for Tx, Gmax = 0.96 nS, z = 1.03, and V1/2 = 40.2 mV. B: a second example is shown, illustrating Tx-dependent inhibition of BK channel activity. Left: activation currents are shown for an outside-out patch excised from a hair cell 0.85 mm away from the apical end. Activation steps ranged from 10 to 100 mV, followed by a deactivation step to 40 mV. Right: normalized G-V curves were fit to a first-order Boltzmann function. The fit parameters are as follows: for control saline, Gmax = 1.44 nS, z = 1.78, and V1/2 = 42.3 mV; for Tx, Gmax = 0.93 nS, z = 1.6, and V1/2 = 53.9 mV. C: the Tx-induced change of averaged maximum steady-state conductance, GmaxTx/Gmaxcontrol = 0.73 ± 0.06 (n = 19), is compared with the change of averaged single-channel conductance in the presence of Tx, SCGTx/SCGControl = 0.94 ± 0.02 (deduced from Fig. 2C). Tx-dependent reduction of Gmax cannot be fully explained by Tx reduction of SCG, as described previously. D: the averaged V1/2 was 51.5 ± 4.6 mV in control saline and 56.7 ± 5.5 mV in Tx (n = 19). The difference was statistically insignificant (P > 0.05, paired Student's t-test). Also shown are measurements of V1/2 in human embryonic kidney (HEK)-293 cells transfected with cDNA encoding chick BK channel: cslo α-subunit alone and cslo α with chick β1-subunits. In recombinant channels, the averaged V1/2 increased from 63.8 ± 4 mV to 67.4 ± 3.8 mV by 1 μM Tx if cells were transfected with α-subunits alone, but it decreased from 61.1 ± 2.4 mV to 47.3 ± 2.8 mV in cells cotransfected with α and β1 (data are based on Ref. 13). *P < 0.05. HC, hair cell.

