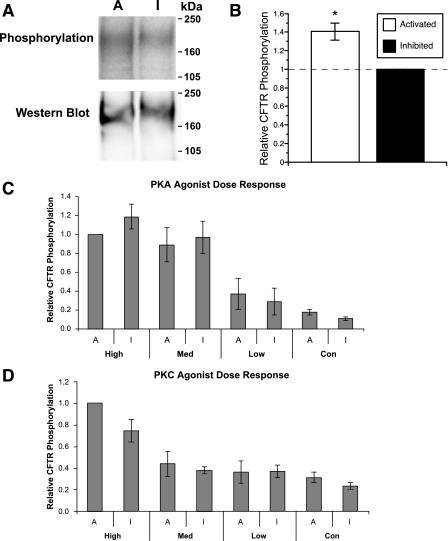
Fig. 3.
In vivo phosphorylation of CFTR expressed in HEK-293 Flp-In T-REx AMPK-DN cells with AMPK either activated (A = uninduced + metformin) or inhibited (I = Tet-induced). A: representative phospho-screen image (top) and immunoblot (bottom) of CFTR on the same membrane. B: summary of mean (± SE) relative CFTR phosphorylation with AMPK activated versus inhibited (*P = 0.005; paired t-test, n = 9). C: relative phosphorylation with graded cellular PKA stimulation (high, 10 μM forskolin + 1 mM IBMX + 250 μM chlorophenylthio-cAMP; Med, 1 μM forskolin + 0.1 mM IBMX; low, 0.1 μM forskolin; n = 4 replicate experiments). D: relative phosphorylation with graded cellular PKC stimulation (high, 100 nM PMA; Med, 10 nM PMA; low, 1 nM PMA; n = 5 replicate experiments). None of the paired samples at any given level of agonist stimulation were significantly different from each other except for the pooled unstimulated controls, as shown in B.

