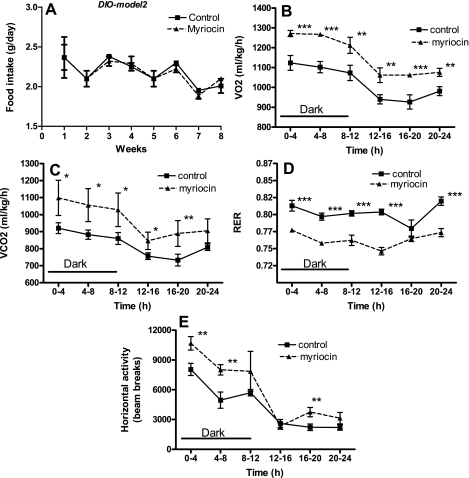
Fig. 5.
Metabolic function in response to myriocin in DIO-model 2 mice. A: food intake throughout the experimental period. Whole body V̇o2 (B), V̇co2 (C), RER (D), and activity (E) were measured as described (CLAMS) in control and myriocin-treated mice at the end of the 8-wk treatment regimen. For A, data are means ± SD (n = 12). For B–E, data are means ± SD (n = 6). *P < 0.05; **P < 0.01; ***P < 0.001.

